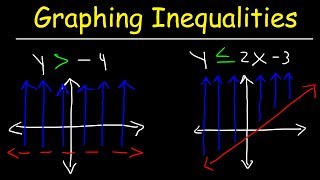
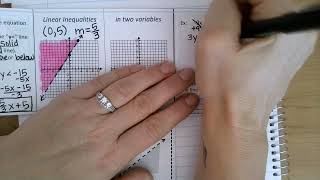
Graphing Linear Inequalities Graphic Organizer: A Practical Guide for Students
Understanding linear inequalities is a cornerstone of algebra, yet many learners feel intimidated by the shift from equations to shaded regions on a coordinate plane. A Graphing Linear Inequalities Graphic Organizer simplifies this transition by providing a visual framework that guides students through each step of the process. In this article we explore why a graphic organizer works, what elements it should contain, and how to use it effectively in the classroom or at home.
Why Use a Graphic Organizer for Linear Inequalities?
Research on math instruction consistently shows that visual scaffolds improve comprehension and retention. A graphic organizer:
- Breaks down complex tasks into manageable pieces, helping learners focus on one decision at a time.
- Encourages active note‑taking by prompting students to record key information such as slope, intercept, and test points.
- Provides a reusable template that can be adapted for any linear inequality, from simple one‑variable forms to systems of two inequalities.
Don’t be intimidated by the idea of shading regions; the organizer turns abstract rules into concrete actions.
Core Components of a Graphing Linear Inequalities Graphic Organizer
Below is a recommended layout that works for most middle‑school and high‑school curricula. Each section is designed to align with the steps presented in many algebra video tutorials, including the introductory lesson found on Cognito.org.
- Problem Statement – Write the inequality exactly as given (e.g., y ≤ 2x + 3).
- Identify the Boundary Line
- Convert the inequality to an equation (y = 2x + 3).
- Determine slope and y‑intercept.
- Decide whether the line is solid (≤ or ≥) or dashed (< or >).
- Plot Points – Choose at least two easy points (often the intercept and another point using the slope) and mark them on the coordinate plane.
- Test a Sample Point – Usually (0,0) unless it lies on the boundary; substitute into the original inequality to decide which side to shade.
- Shade the Correct Region – Use a light pencil or colored pencil to fill the appropriate side of the line.
- Check Your Work – Verify that the shaded region matches the test point result and that the line style matches the inequality sign.
Step‑by‑Step Walkthrough Using the Organizer
Let’s apply the organizer to the inequality y > -½x + 4. Follow each column of the graphic organizer as you work.
1. Problem Statementy > -½x + 4
2. Identify the Boundary Line- Equation: y = -½x + 4